Biosignal-Based Stress Detection
Detecting stress states from ECG, GSR, and heart rate signals using machine learning
✨ Motivation
This project investigates whether biosignals including electrocardiogram (ECG), galvanic skin response (GSR), and derived heart rate can be leveraged to distinguish stress from relaxation. Unlike studies using publicly available datasets, we collected raw data firsthand with professional-grade BIOPAC hardware and designed a controlled experimental protocol. This process also explored how biofeedback principles, specifically monitoring and visualizing physiological responses, could improve awareness of stress states.
🧭 Experimental Protocol
Participants:
- 5 adult volunteers (self-reported healthy)
Equipments:
- BIOPAC MP3X Data Acquisition Unit
- SS2LB ECG lead set
- SS3LA GSR finger sensors
- Disposable ECG electrodes
- BIOPAC AcqKnowledge software
Sensor Placement:
The ECG and heart rate were obtained by placing three electrodes on the right wrist, right ankle, and left ankle. Two electrodes were attached to the index and middle fingers to record GSR, measuring the conductivity between them.
Sampling & Windowing:
- Sampling rate: 100 Hz
- Feature extraction window: 1-second non-overlapping windows
Protocol Phases:
- Relax: 45 seconds (eyes closed) —> Period 1
- Stress: 3 consecutive 45-second stressors:
- Counting backward by 17 —> Period 2
- Word chaining under time constraint —> Period 3
- Complementary multiplication —> Period 4
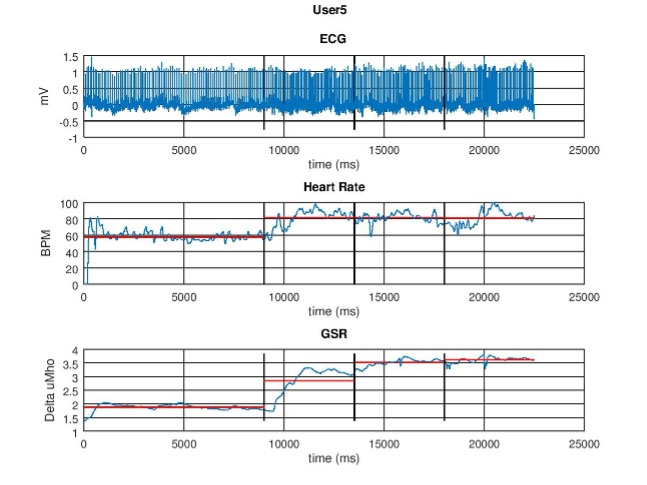
🫀 Data Collection and Example Signals
Signals were monitored in real time to ensure electrode contact and stability. Below are representative trends:

🧠 Feature Extraction
For each 1-second window, the following features were computed per modality:
- Mean
- Standard Deviation
- Minimum and Maximum
- Range (Max–Min)
- Slope (especially for GSR)
These features were concatenated into a single vector describing each segment.
🤖 Classification Pipeline
Three classifiers were trained to label windows as Stress or Relax:
- Support Vector Machine (SVM)
- Decision Tree (DT)
- Random Forest (RF)
Evaluation:
10-fold stratified cross-validation was used to estimate generalization performance.
🧪 Results
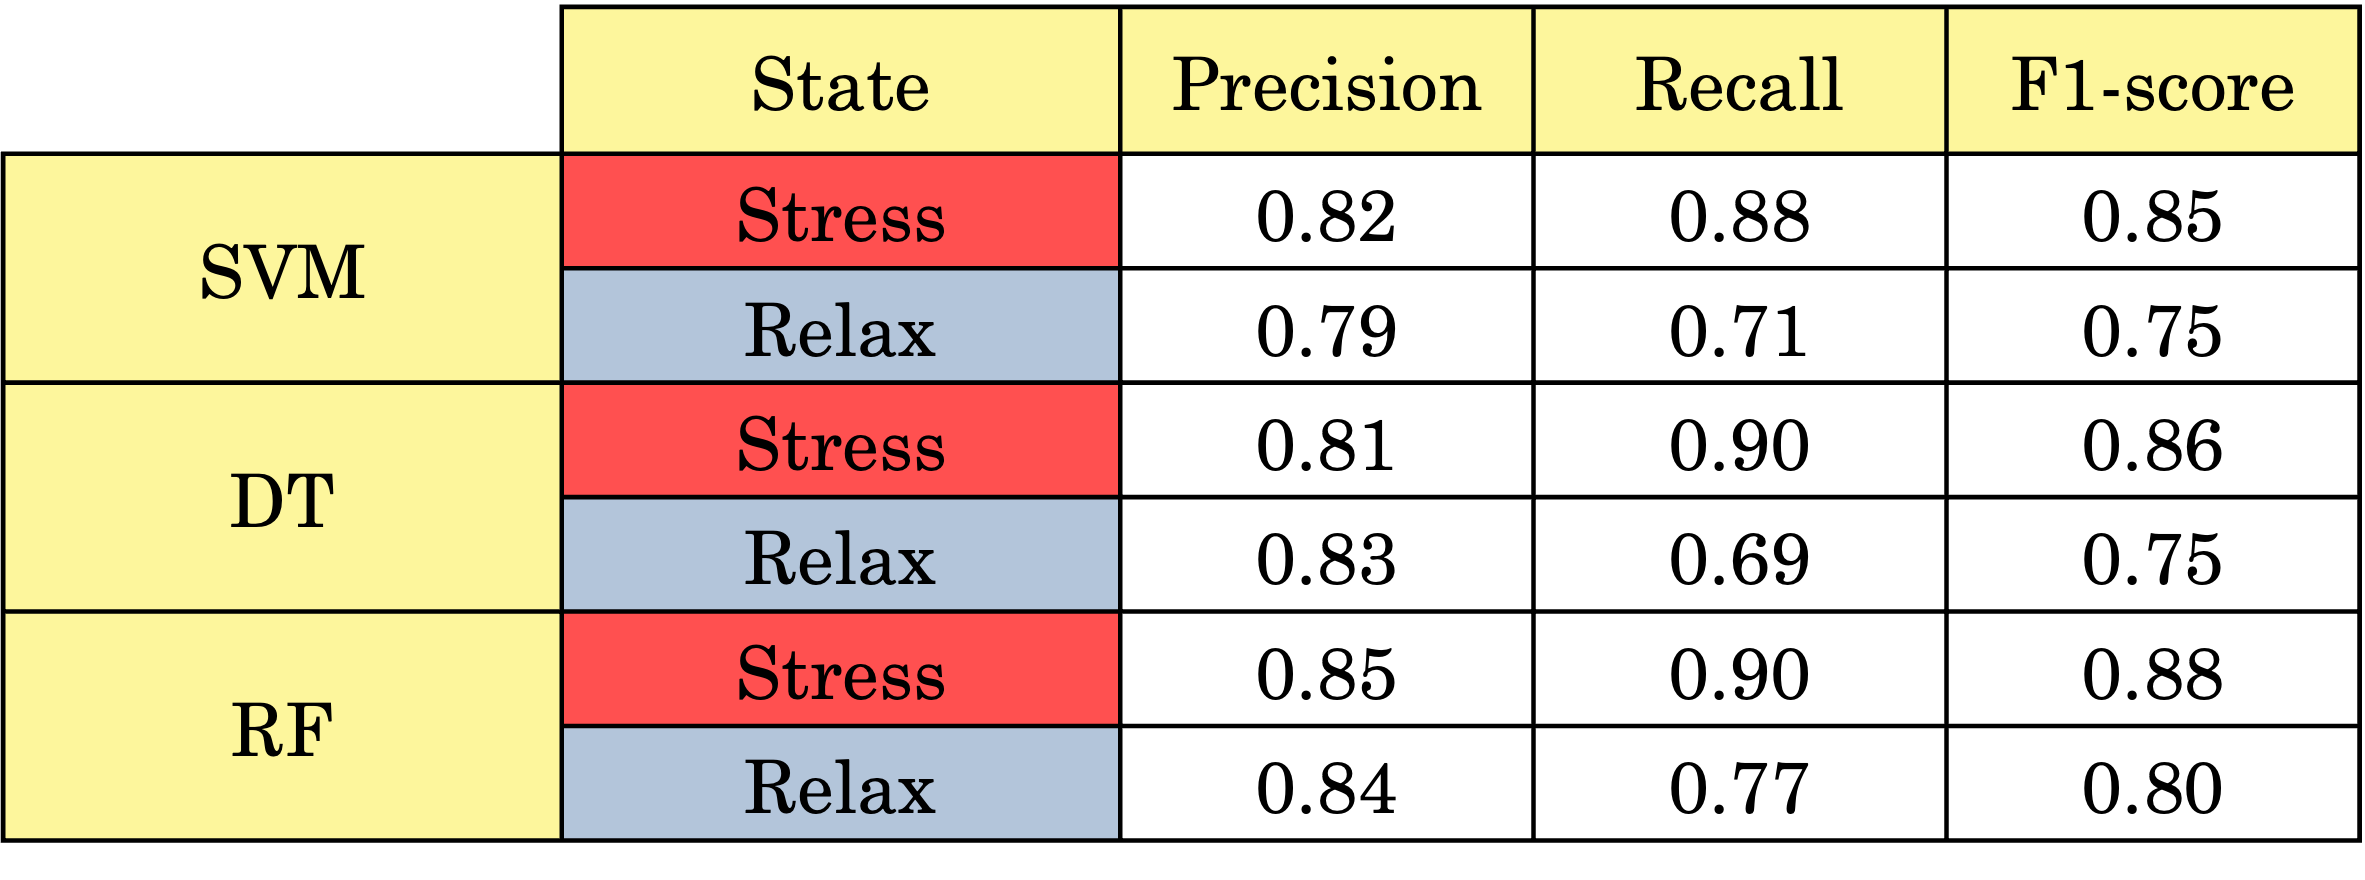
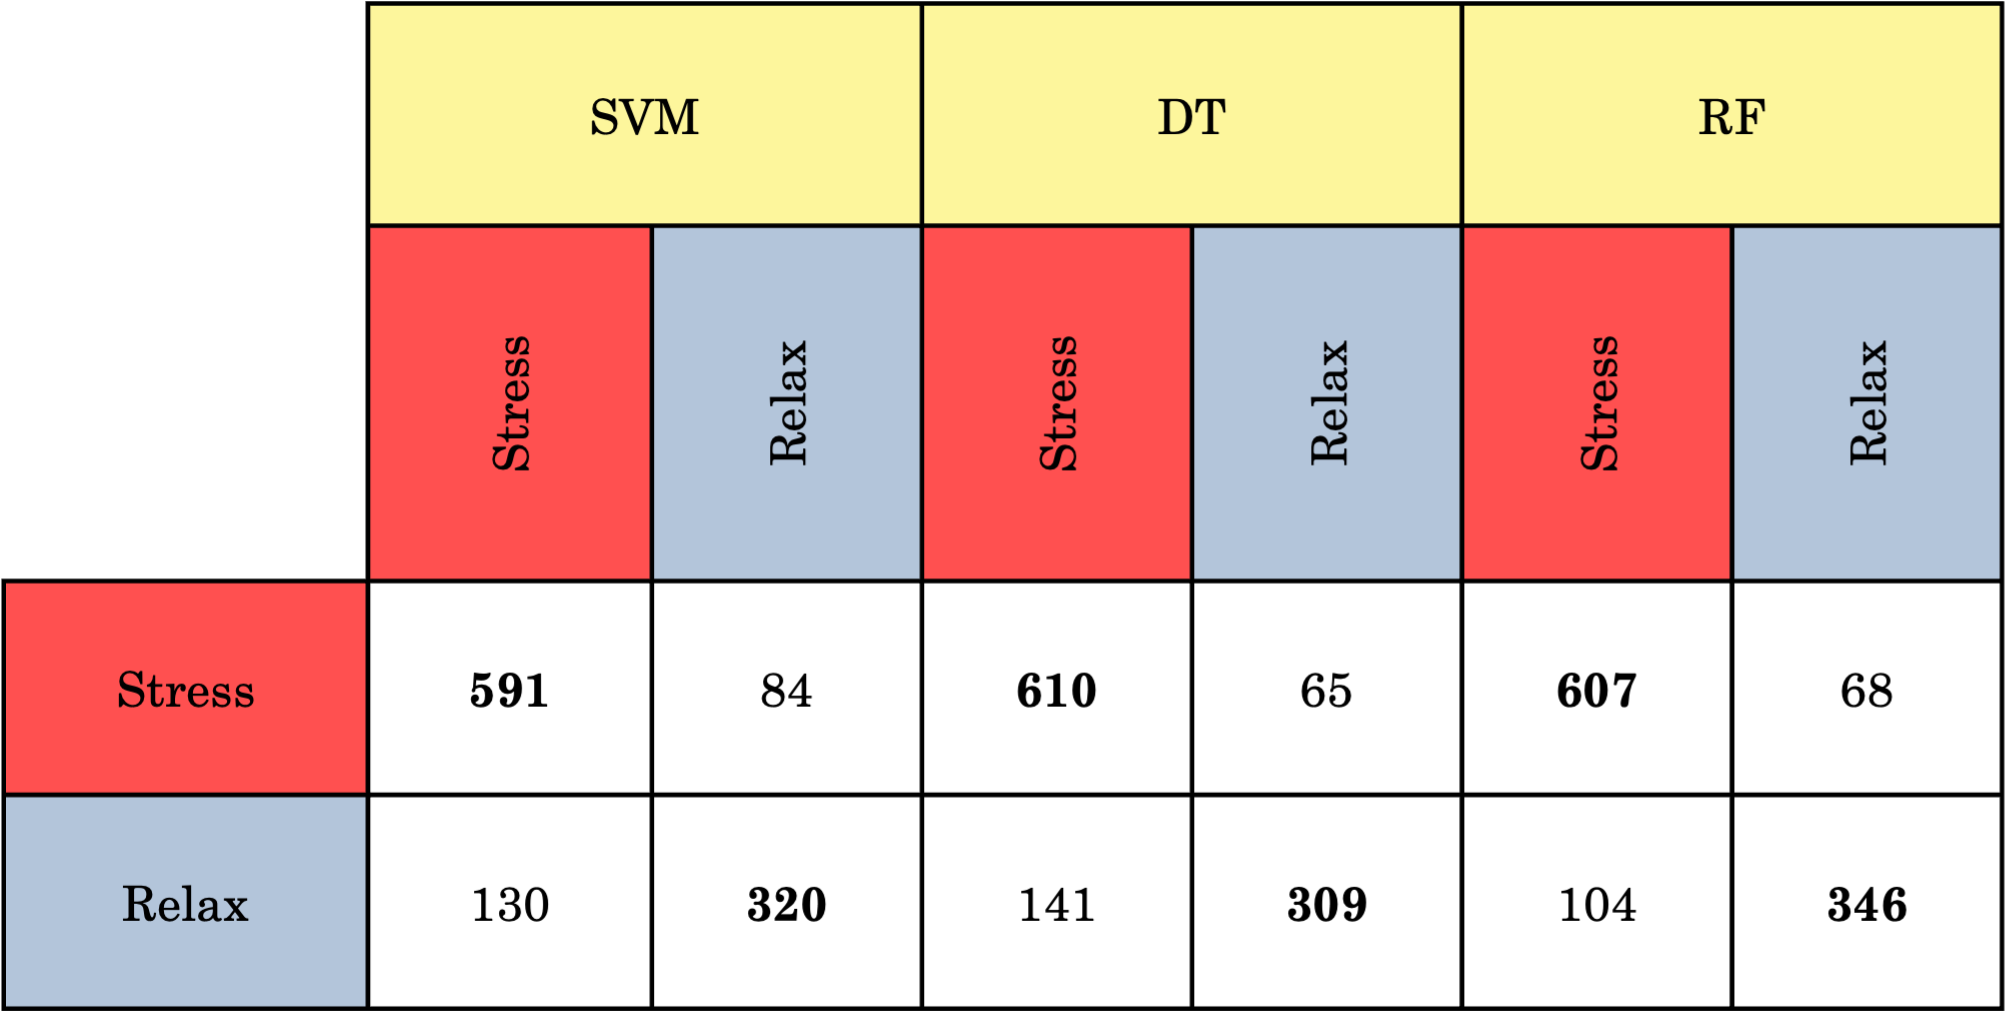
Random Forest consistently outperformed the other classifiers, providing the most balanced precision and recall.
Example Confusion Matrix:
📊 Additional Visuals
Below are examples of how the values changed between periods:
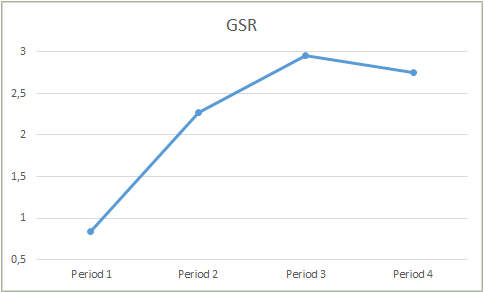
GSR time series
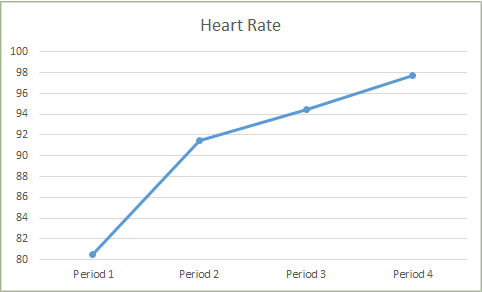
Derived heart rate (BPM) from ECG R-peaks
📝 Key Takeaways
- Combining GSR and heart rate features yielded the highest classification accuracy.
- Feature variability across individuals underscored the need for larger datasets.
- The project demonstrated that even with limited data, wearable biosignals can distinguish stress.
- Future work could include time-frequency analysis and real-time feedback applications.
⚙️ Technical Stack
- Acquisition: BIOPAC MP3X, SS2LB ECG, SS3LA GSR, EL503 electrodes
- Software: BIOPAC AcqKnowledge, Python, scikit-learn
- Evaluation: Stratified cross-validation